Implementing Pie Chart in Asp.Net MVC
Overview of Pie Charts
A pie chart is a circular statistical graphic that is divided into slices to illustrate numerical proportions. Each slice represents a category's contribution to the total, making it an effective way to compare parts of a whole. In web development, pie charts are frequently used in dashboards, reports, and data visualization tools to provide insights into data distribution.
Using pie charts in your ASP.NET MVC applications can enhance user experience by providing clear and engaging data presentations. They can be utilized in various scenarios, such as displaying sales data, survey results, or resource allocations. This tutorial will guide you through the process of integrating pie charts into your ASP.NET MVC application using the AM Charts library.
Prerequisites
Before you start implementing pie charts in your ASP.NET MVC application, ensure you have the following prerequisites:
- Basic knowledge of ASP.NET MVC framework.
- Familiarity with JavaScript and JSON data formats.
- Visual Studio installed on your machine for development.
- AM Charts library included in your project.
Setting Up AM Charts Library
To begin using the AM Charts library in your ASP.NET MVC application, you need to include the necessary scripts in your view. You can easily do this by adding the following script tags in the head or body of your view:
<script src="//cdn.amcharts.com/lib/4/core.js"></script>
<script src="//cdn.amcharts.com/lib/4/charts.js"></script>
These scripts load the core functionalities and charting capabilities of AM Charts. After including these scripts, you can start creating pie charts using either static data or dynamic data fetched from your server.
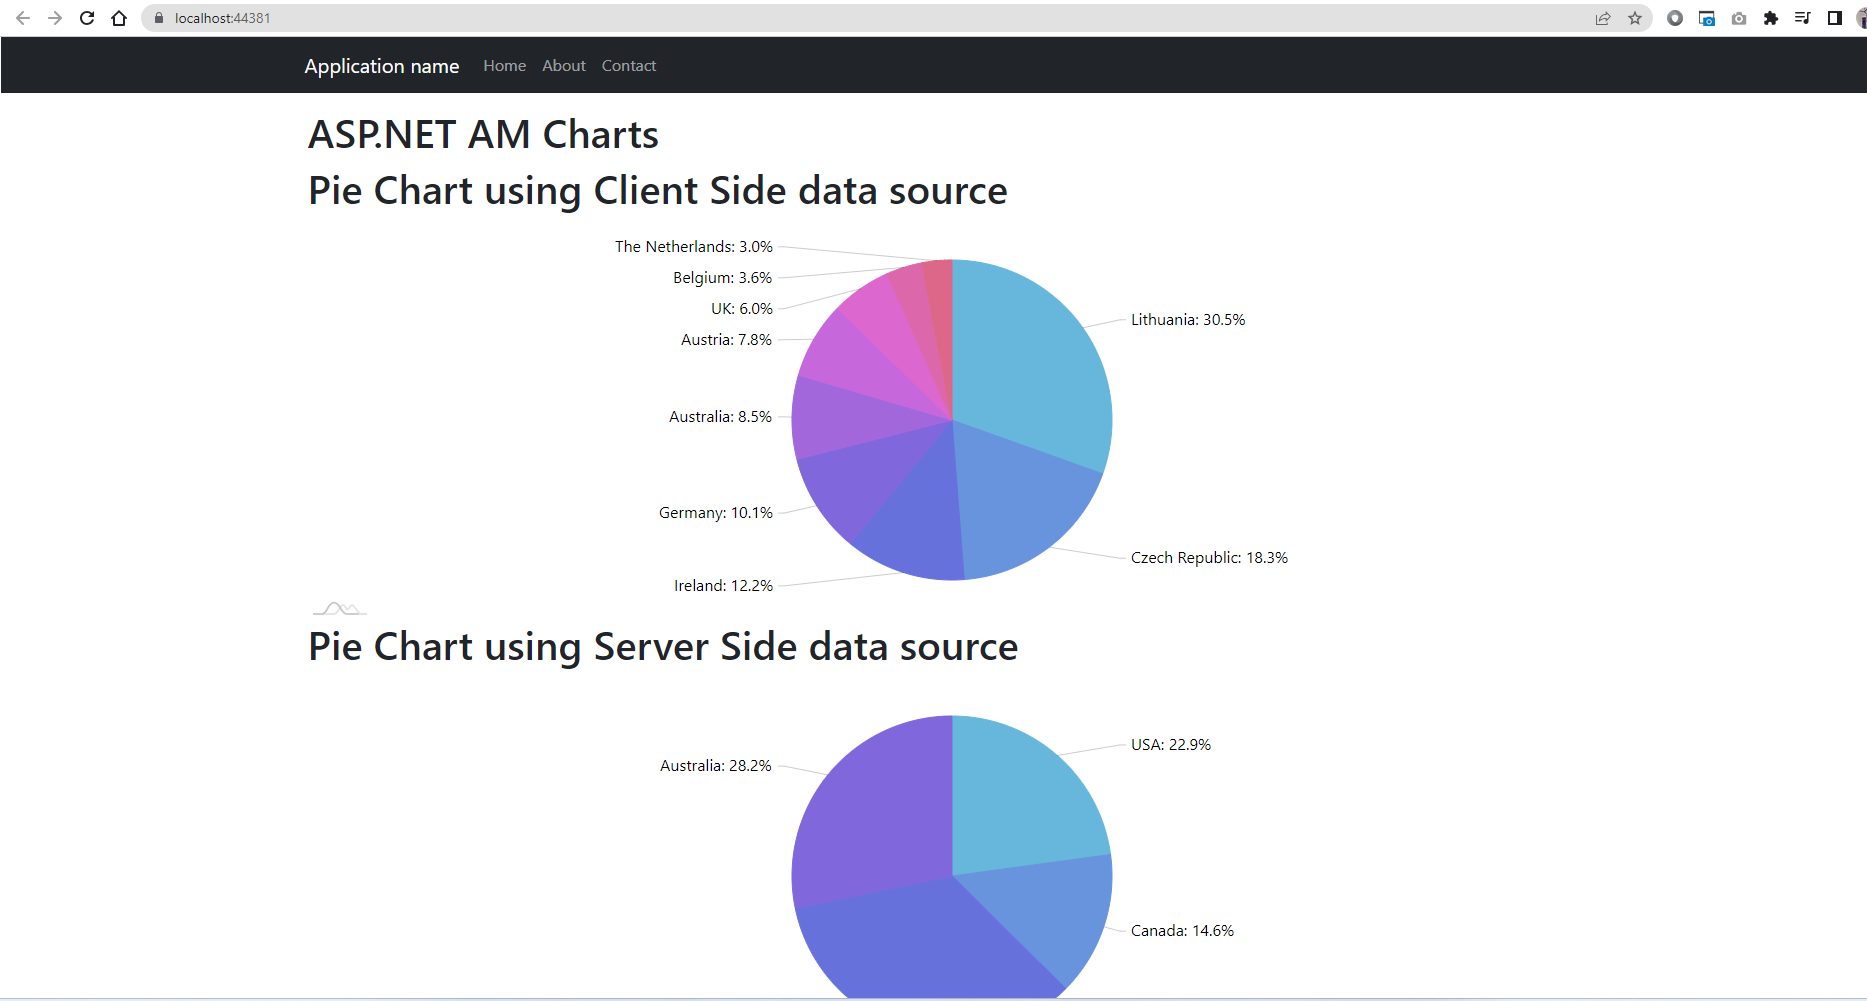
Creating Pie Chart with Client-Side Data
Creating a pie chart using client-side data is straightforward. You can define your data directly within the JavaScript code. Here’s how you can create a pie chart with static data:
// Create chart instance
var chart = am4core.create("chartdiv", am4charts.PieChart);
chart.data = [
  { "country": "Lithuania", "litres": 501.9 },
  { "country": "Czech Republic", "litres": 301.9 },
  { "country": "Ireland", "litres": 201.1 },
  { "country": "Germany", "litres": 165.8 }
];

// Add and configure Series
var pieSeries = chart.series.push(new am4charts.PieSeries());
pieSeries.dataFields.value = "litres";
pieSeries.dataFields.category = "country";
This code snippet initializes a new pie chart and populates it with an array of data representing different countries and their corresponding values. The pie series is then configured to use the "litres" field for values and the "country" field for category labels.
Creating Pie Chart with Server-Side Data
Integrating server-side data into your pie chart allows for more dynamic and relevant data visualization. In this case, you will need to pass data from your MVC controller to the view. Below is an example of how to fetch data from the server and use it in a pie chart:
public ActionResult Index() {
    List<FuelData> fuelDataList = new List<FuelData> {
        new FuelData { country = "USA", litres = 50.5m },
        new FuelData { country = "Canada", litres = 32.2m },
        new FuelData { country = "Germany", litres = 75.9m },
        new FuelData { country = "Australia", litres = 62.4m }
    };
    return View(fuelDataList);
}
In the view, you will serialize this data to JSON format to be used by the chart:
var allTypesData = JSON.parse('@Html.Raw(JsonConvert.SerializeObject(Model))');
var chart2 = am4core.create("chartdiv2", am4charts.PieChart);
chart2.data = allTypesData;

var pieSeries2 = chart2.series.push(new am4charts.PieSeries());
pieSeries2.dataFields.value = "litres";
pieSeries2.dataFields.category = "country";
Edge Cases & Gotchas
When implementing pie charts, keep in mind some edge cases and potential pitfalls:
- Data Format: Ensure that the data passed to the chart is in the correct format. The properties specified in the chart configuration must match the keys in your data objects.
- Empty Data: If the data array is empty, the chart may not render correctly. Implement checks to handle such scenarios gracefully.
- Browser Compatibility: Test your charts across different browsers to ensure consistent rendering, as some features may not be supported in older browsers.
Performance & Best Practices
To ensure optimal performance when using AM Charts in your ASP.NET MVC applications, consider the following best practices:
- Minimize Data Size: Only send the necessary data to the client. Large datasets can slow down rendering and responsiveness.
- Lazy Loading: For applications with extensive datasets, consider implementing lazy loading to fetch data as needed rather than loading everything at once.
- Chart Caching: If the data does not change frequently, cache the chart data on the server to reduce processing time and improve load speeds.
Conclusion
In this tutorial, we have learned how to implement pie charts in ASP.NET MVC using the AM Charts library. We explored both client-side and server-side data integration methods, along with best practices for performance optimization.
Key Takeaways:
- Pie charts are effective for visualizing parts of a whole.
- AM Charts provides powerful charting capabilities for ASP.NET MVC applications.
- Data can be integrated from both client-side static arrays and server-side dynamic data.
- Always validate and format data correctly to avoid rendering issues.